

Legend
Common Execution Errors
When running tests you may encounter execution errors (yellow) where a test failed to start at all. Common causes:- Ironic status in clean fail / error / etc. — Raise a ticket with OpEng.
- Node not enrolled — Run the Enrollment workflow. If it fails, raise a ticket with OpEng.
- Node missing or down in Slurm — This will be apparent in the error message. Raise a ticket with FM.
- Test-specific issues (e.g. only one test type fails) — See the test-specific troubleshooting guides further in this document.
A rerun that never starts
If a rerun sits queued for a long time on nodes that look idle in Fleet Manager, the previous attempt’s Slurm job may still be holding them. Fleet Manager cancels the Slurm job and confirms it stopped before it marks a test failed, and records the outcome of that cleanup:Scheduler Cleanup: unconfirmed line means Fleet Manager could not confirm the Slurm job
stopped — check the reported job with squeue -j <slurm-job-id> on the login node and raise a ticket
with FM. confirmed or already_terminal means the nodes were released and the queue wait is
something else.
Slurm jobs submitted by Fleet Manager are named fm-<test slug>-<hash>, so squeue --name finds a
specific test’s job and the fm- prefix identifies Fleet Manager’s jobs in a shared queue.
A test that fails with BURN_IN_DUPLICATE_SLURM_SUBMISSION
Two Slurm jobs are queued under one test’s name, so Fleet Manager cannot tell which allocation it
owns and deliberately refuses to guess. Both job IDs are named in the failure message. Decide which
one to keep — if either is already running usefully, keep it — scancel the other, then rerun.
Fleet Manager will not cancel either on its own, because doing so could destroy a run that is about
to produce real results.
Fleet Manager Features
Device Selection Filter
The device selection panel includes a filter on the right-hand side that lets you narrow down nodes by attributes such as Rack. This is the primary way to select nodes for a batch test run.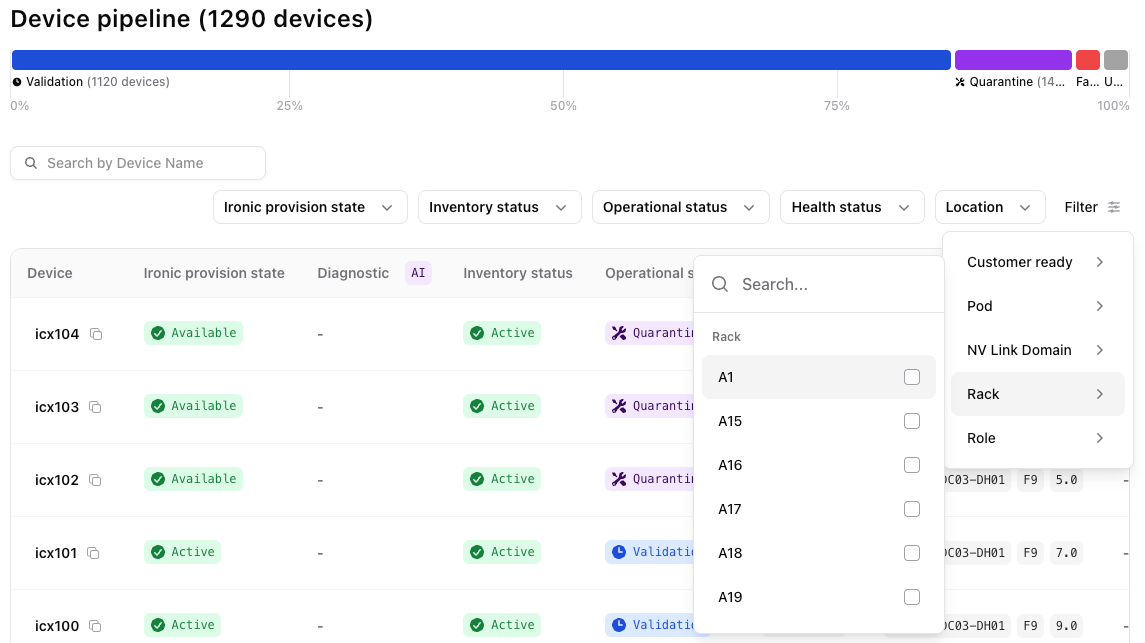
Test Presets
Burn-in testing involves feeding parameters into jobs, which makes it quite flexible. Certain parameter combinations are known to be good and form our standard test suite. These are packaged as Presets for convenience. When you go to run a job, select from the Presets dropdown. For example, GB300 - Deployment runs all standard single-node tests for GB300 hardware.The global GB300 preset does not currently run the
nvme_cli_health SMART check.
NVMe data-drive paths vary by site, so the check remains disabled until presets can
select a site or storage descriptor. Do not treat a standard GB300 burn-in as evidence
that NVMe wear or critical_warning status was checked. B200 presets do include this
check. The planned configuration path is tracked in
docs/adr/0028-hardware-descriptor.md.Running a Custom Set of Tests
If you want to run a specific subset of tests — for example, GB300 - Deployment but without the Nemotron training job — find its entry in the JSON parameter string and delete it. Removing a test’s JSON block means it will not run at all. You can also mix JSON from different presets to build a custom combination. The test parameters are a JSON string. See Test Presets for the preset selection flow. When editing the JSON, make sure the result remains valid JSON.Making Your Own Presets
You can create personal presets:- Edit the JSON string to your desired configuration.
- Click Save Changes.
- Click Create a new preset, give it a name, and save.
How to See Results
Burn-in View
The Burn-in view shows the status of all tests. You can filter by rack and by test type — selecting one test shows finer-grain detail for that test. The default view is single-node; switch to the Collective tab to see multi-node test results.Job Result View
For an individual job, navigate to the job and select the Results tab.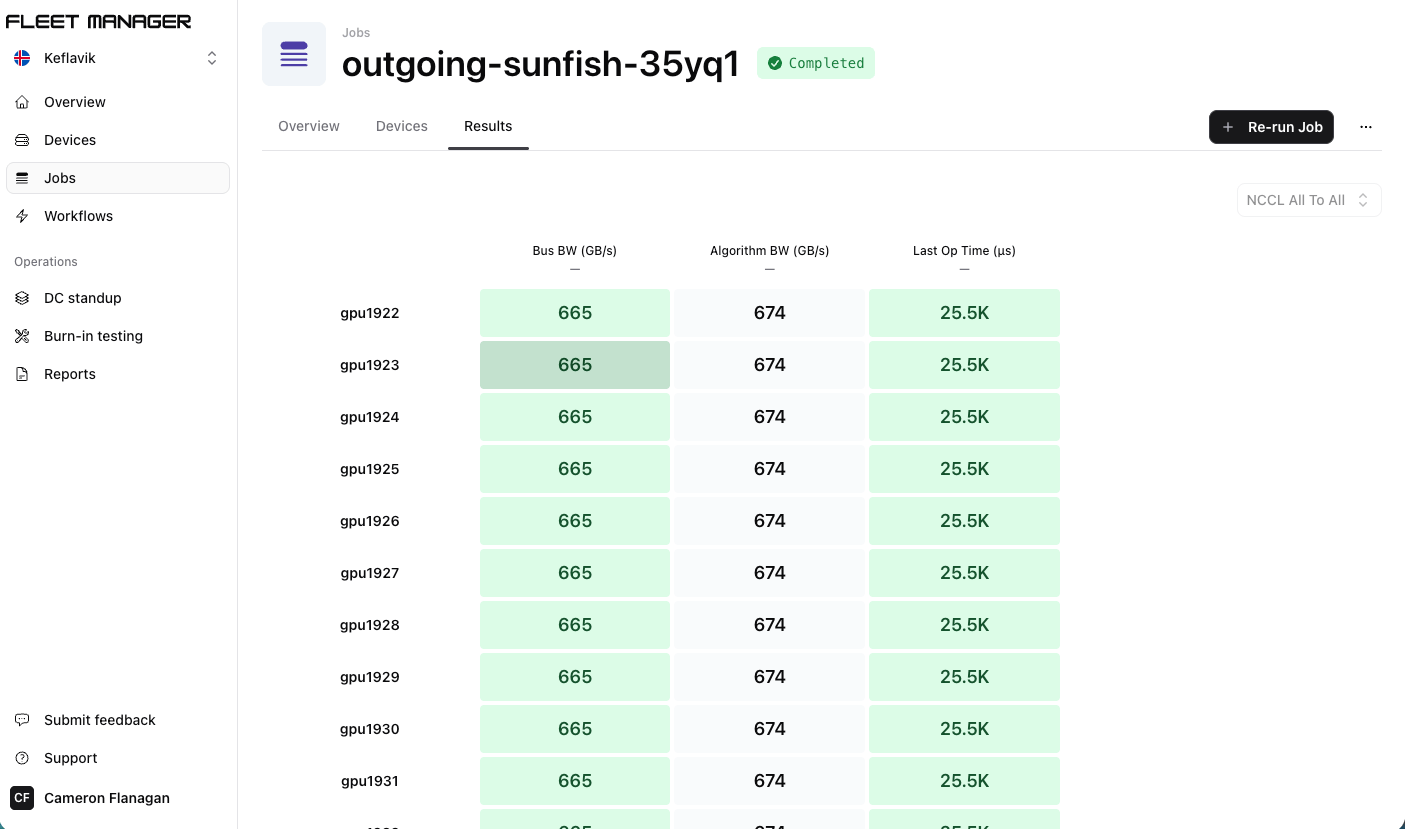
Device History View
Shows the full history of tests run on a specific device and when they ran. Which view to use depends on your goal — explore and find a workflow that suits you. Feedback is very welcome; contact @liam.leighton on slack, our Lead UX designer in FM.Testing Chronology
We run tests in this order:- Single-node tests — shake out issues on each node before moving to multi-node.
- Rack-level multi-node tests — validate intra-rack communication.
- Multi-rack / multi-pod tests — validate cross-rack and cross-pod communication.
- 48h rack-level burn-in — run only after all multi-rack tests have passed.
- Exemplar tests — run only after all other tests (including 48h burn) have passed.
Single-Node Tests
Running Single-Node Tests
Select the Single Node workflow. Use the device selection filter on the right, select Rack, search for your racks, and add them to the filter. Then select all nodes in the rack. GB300 racks have 18 nodes each, so expect:- 1 rack → 18 nodes
- 4 racks → 72 nodes
- 8 racks → 144 nodes
NCCL — NVLink Domain
Tests NVLink communication within the node. Poor performance (red, significantly below threshold) can indicate:- Another process is using the NVLink domain (should not happen but is possible if a job is running outside FM/Slurm).
- A physical connection issue.
- A software/firmware domain issue.
- Re-run the NCCL tests. Select the relevant single-node NCCL preset and re-run. NCCL tests are quick. If it passes, we’re good.
- Reseat the tray — there may be a connectivity issue. Then re-run all single-node tests.
NCCL — IB Domain (Loopback)
Tests the IB fabric by sending a message out via the IB fabric and back to itself. Poor performance here indicates:- The IB fabric is in use (should not happen, but it can).
- An IB connectivity problem.
- IB switches are not configured properly.
- Re-run the NCCL loopback tests. Select the GB300-nccl-IB-test-loopback preset for the single-node test workflow and re-run. If it passes, we’re good.
- Reset the tray. Re-run all single-node tests.
- If the issue persists after resetting the tray, raise a ticket with OpEng/FM.
DCGMI (Level 4)
An in-depth test of compute health that requests NVBandwidth and the full Extended Utility Diagnostics (EUD) profile. Level 4 is an opt-in test and is not part of the current GB300 Deployment preset. Reserve a four-hour job timeout; the validated GB300 run took 1 hour 52 minutes, but the exact duration depends on the hardware. EUD must support the target GPU, be installed at the same version as the NVIDIA driver, and run with MIG mode and competing GPU telemetry disabled. Fleet Manager requires both EUD and NVBandwidth to reportpass. A missing or skipped result
fails the test because the diagnostic did not produce a health verdict. Failing tests surface
descriptive status details, including the EUD summary warnings reported in DCGM’s JSON output.
Troubleshooting (in order):
- Re-run the test — it is a significant stress test and may pass on a second run.
- If it still fails, raise a ticket with OpEng/FM to investigate the specific error.
Single Node Health Check
A lightweight version of DCGMI that runs quick health commands and bundles many sub-tests. It is cheap to run. Like DCGMI, check the specific errors it highlights. Common errors and their fixes:-
IMEX domain down — The
nvidia-imextopology service is not running on the node. It is often disabled by default, and can also come back disabled after a reboot, so a freshly provisioned or rebooted node frequently comes up with IMEX down, which fails MNNVL-based tests (unhandled cuda errorat buffer alloc). As a workaround, enable and start it on the node:sudo systemctl enable --now nvidia-imex(verify withnvidia-imex-ctl -q, which should returnREADY). If it will not stay up, raise a ticket with HPC/OpEng. - Xid errors — Power-cycle the node and re-run the test. If the issue persists, raise a ticket with OpEng/FM.
- HBM remap errors — Power-cycle the node and re-run the test. You may still see Xid errors after the cycle; those need to be cleared manually (FM is working on automating this). If errors persist, raise a ticket with OpEng/FM.
- RDMA link errors — Raise a ticket with OpEng/FM to clean and reseat the affected link. If the issue persists, raise another ticket to have the link swapped/replaced.
-
VAST_NOT_READY— Thevast_mountreadiness check found the VAST share unusable, so storage-dependent tests (Elbencho, the nemotron checkpoint tests) will fail if they are dispatched. Fix the mount before re-running; do not drop the check to unblock the pipeline. Two things emit this marker, with the same sub-reasons and the same meaning: the opt-invast_mountcheck insidesingle-node.node-health-check, run as a pipeline gate, andsingle-node.storage-elbencho, which re-runs the same check itself before benchmarking so a mount that dropped after the gate cannot be measured as a healthy node. From the Elbencho test the marker arrives as the job’s failure message rather than a health-check metric. The message carries a machine-readable sub-reason,VAST_NOT_READY[<REASON>]: <detail>:NOT_MOUNTED— the path is not a distinct mount. VAST is not mounted, and writes would land on the node’s root filesystem.WRONG_FILESYSTEM— something is mounted, but it is not VAST. Either the filesystem type is outsideexpected_fstypes(a local volume standing in for the share), the export does not matchexpected_source_pattern, or a directory that will be written is not on the device that was just identified — aprobe_subdiror arequire_paths_on_mountentry crossing a symlink or nested mount, or the mount being replaced mid-check. Fromsingle-node.storage-elbenchothis is also how adata_dirthat looks like it is under/vastbut resolves onto other storage is caught: that test declares itsdata_dirviarequire_paths_on_mount, which compares the device of the deepest ancestor that exists — so the directory the job will create itself does not have to exist yet. The second case is the split-brain one: this node is on a fallback export while the rest of the site is on real VAST. The server address varies per site but the export name does not — osl1 serves192.168.255.199:/fleet-slurmand lon14192.168.238.191:/fleet-slurm— so:/fleet-slurm$is the pattern to configure unless your site is known to differ.TRANSPORT_DEGRADED— the mount is present and is the right export, but the node has fewer thanmin_established_peersestablished TCP connections to its NFS data plane. The message reports how many sockets are stuck inSYN-SENT; a high SYN-SENT count with zero established peers means the VAST data addresses are unreachable from this node, so this is a network or storage-endpoint fault to route to networking rather than a node fault. Peers are counted only within the mount’s ownremoteportsrange, so an established connection to some other NFS server never reads as reachability.NOT_USABLE— mounted, but the SLURM job user cannot read and write it. Permissions, or a read-only export root — setprobe_subdirto the tenant directory the workload uses.NO_SPACE— free capacity is below the configuredmin_free_gibfloor.HUNG— the mount did not respond withinprobe_timeout_seconds. A hard-mounted export blocks indefinitely when its cluster is unreachable, so this is the usual signature of a VAST outage rather than a node fault.probe_timeout_secondsis one budget shared by every stage that can block on the mount, not a budget per stage, so keeping it belowper_check_timeout_secondsis sufficient to guarantee this check reports its own actionable reason instead of the runner’s generic timeout.FINDMNT_FAILED— the mount table could not be read or parsed. This is a fault in the check’s own environment, not a verdict about VAST.
min_free_gib, leave headroom for an in-flight hardware-test image preparation. Preparation is serialized to one Job per site and downloads images sequentially, replacing each atomically, so a refresh transiently holds both the old and the new copy of a single image. Size the floor above that transient — an aggressive floor turns a perfectly healthy refresh window into a confusingVAST_NOT_READY.
NVMe-fio
Tests the health and performance of NVMe storage. Troubleshooting (in order):- Re-run the test.
- If the test fails to run at all (execution error / yellow), this can indicate a missing NVMe controller. Check whether the controller is physically present. If not, a node swap may be required — raise a ticket with OpEng to see if they can recover it first.
- If the controller is present, power-cycle the node and re-run the test.
- If there is a persistent failure or performance is below expected, raise a ticket with OpEng.
NVMe self-test
single-node.nvme-self-test is a single-node burn-in test that runs the controller’s
native NVMe diagnostic for explicitly configured data drives. It intentionally reuses the
PCI by-path inputs from NVMe FIO rather than discovering drives at runtime, keeping OS and
unexpected drives out of scope. Set test_length: short for a quick diagnostic or
extended with a vendor-appropriate max_wait_minutes. The test fails when a controller
is already testing, cannot produce a completed matching result, or reports a non-zero result
code. It is non-destructive and separate from the fast SMART Node Health Check.
Troubleshooting (in order):
- Re-run the short self-test to distinguish a transient command failure from a persistent controller diagnostic result.
- For a persistent non-zero result, retain the test artifacts and raise a ticket with OpEng.
Single Node Nemotron Training
A small LLM training job run as a full end-to-end test on a single node. Troubleshooting (in order):- Re-run the test — it is a significant stress test and marginal failures may pass on a second run.
- If performance is still poor, check whether the other single-node tests have been run. If not, run all single-node NCCL tests and the health check first — they may point to a specific problem. Follow their troubleshooting guides as needed.
- If the above did not highlight an issue, run the DCGMI tests. Those may surface a specific compute issue. Follow the DCGMI troubleshooting guide.
- If there is no apparent explanation from other tests and performance remains poor, raise a ticket with FM.
Congratulations on running all single-node tests! Now onto multi-node.
Rack-Level Multi-Node Tests
Running Rack-Level Tests
Select the Multinode Collective workflow. Use the device selection filter, select Rack, search for your rack, and add it to the filter. Select all nodes in the rack — expect 18 for GB300 racks. If the count is lower, check whether all nodes are enrolled.NCCL All-to-All
A quick test that checks communication between nodes within the rack. Troubleshooting (in order):- Re-run the test — it’s quick and easy.
- If the test fails to run at all (yellow execution error), raise a ticket with FM. It may be that an NVLink service is not running or nvswitch is not configured.
- If performance is still poor, check that all single-node tests for the nodes in the rack passed. If they have not been run, run them and follow their troubleshooting guides.
- If there is no explanation so far, raise a ticket with FM. A reseat may be required.
NCCL All-Reduce
Another quick test that checks communication between nodes within the rack. Troubleshooting: Same as rack-level NCCL All-to-All.NVLoom
A longer-running test (~2 hours) that tests a broad swathe of the fabric with many sub-tests. Troubleshooting:- Check the NVLoom sub-test results to see if they point to a specific issue. For any issue, raise a ticket with FM.
Nemotron 48h Burn-in and Corruption Check
This runs a 48-hour burn-in on the rack, made up of 24 sequential 2-hour Nemotron training jobs with performance and deterministic-compute checks between each iteration. It exits early with a failure if those checks are not met. Troubleshooting (in order):- Check whether other tests have been run and passed (single-node and rack-level NCCL). If not, run them and follow their troubleshooting guides.
- If the above tests have passed, raise a ticket with FM.
Multi-Rack Tests
Running Multi-Rack Tests
Select the Multinode Collective workflow. Use the device selection filter, select Rack, search for your racks, and add them all to the filter. Select all nodes across those racks — expect 18 nodes per rack:- 4 racks → 72 nodes
- 8 racks → 144 nodes
- 16 racks → 288 nodes
Selecting the Right Devices
Pod-Level Multi-Rack NCCL
A quick check that runs in the IB fabric and verifies communication across racks. Select 4 racks in the same pod — expect 72 nodes for GB300s. Use the GB300 L12.6 - NCCL Collective 4 Rack for this test. Troubleshooting (in order):- Check that all single-node and rack-level NCCL tests have been run and passed. If not, run them and follow their troubleshooting guides.
- If the above tests have passed, raise a ticket with FM. A common issue is that a required
fabric service (
opensm) is not running, which prevents the full fabric performance from being utilised.
Pod-Level Nemotron Checkpoint Test
Tests the performance of saving and loading a Nemotron training checkpoint. A relatively quick test. Select 4 racks in the same pod — expect 72 nodes for GB300s. Use the nemotron-checkpoint-vast for this test. Troubleshooting (in order):- Check that all single-node and rack-level NCCL tests have been run and passed. If not, run them and follow their troubleshooting guides.
- If performance drops significantly on any multi-node LLM training job, including the exemplar tests, re-run the single-node health check and the single-node NCCL tests on the nodes involved. This is often the fastest way to identify whether the regression points to a node-local hardware, firmware, or fabric issue before treating it as a rack- or pod-level problem.
- If the above tests have passed, raise a ticket with FM.
Network-Block (Pod-Level) Nemotron Test
Runs a Nemotron training job across 4 racks in the same pod. Expect 72 nodes for GB300s. Run in two stages:- Smoke test — select the GB300 - L12.20 - 4-rack nemo smoke (50 iters) for a quick pass/fail check.
- Full test — if the smoke test passes, select the GB300 - L12.20 - 4-rack nemo 2h to run the official 2-hour test.
- Check that all single-node and rack-level NCCL tests have been run and passed. If not, run them and follow their troubleshooting guides.
- If the above tests have passed, raise a ticket with FM.
Multi-Network-Block (Multi-Pod) Nemotron Test
Runs a Nemotron training job across 16 racks spanning 4 complete pods. Expect 288 nodes (18 × 16) for GB300s. Same two-stage approach as the pod-level Nemotron test:- Smoke test — select the GB300 - L12.20 - 16-rack nemo smoke (50 iters).
- Full test — if the smoke test passes, select the GB300 - L12.20 - 16-rack nemo 2h.
After Multi-Rack Tests: Run 48h Rack-Level Burn-in
Now that all multi-rack tests have passed, run the deferred Nemotron 48h Burn-in and Corruption Check for each rack.Exemplar Tests
Exemplar tests are a “nice to have” set of tests that allow us to reach Exemplar Cloud status.
Run them only after all other tests have passed, including the 48h rack-level burn-in.
Note: thresholds for Exemplar tests have not yet been fully calibrated — running is good to go,
but treat results with that context in mind.